


|
|
|
|
|
|
| The development of a test and measurement setup for 455 kHz IF filters. (c) PE1ABR |
Nederlands? |
|
Here is the long story about the design process to achieve a good working test setup to measure 455 kHz IF filters very accurately. To be precise to -100 dB deep! With new developments even well below it. This in response to the desire to build an additional
IF buffer stage in an existing professional receiver to provide it with additional filters in cascade with the existing ones. This was to greatly enlarge the slope and the stopband-suppression with at least 30 to hopefully 40 dB improvement.
Because manufacturers filter specifications sometimes should be taken with a grain of salt, it must be very clear in advance what the real filter performances are. I.e. in some manufacturers filter specifications there is NOT how such a filter really performs, but what the limits are within which the filter specifications should be. A 4 kHz Murata (CF#455IT series, replace # for the W, M or K) is defined as definitely not smaller than ± 2 kHz, to begin intended is: 4 kHz total. Well, exactly 4 kHz, they are certainly NOT! In reality, the filters from the IT series are all around 6.3 to 7.2 kHz at -6 dB. The Murata HT series is a bit wider and is defined as not less than 6 kHz, in reality, these are measured as 7.5 to 8.7 kHz exactly! Also, some filter series are up to 1 to 1.5 kHz squint, I mean by squint ”off center”, thus shifted from 455,000 Hz exactly. This is only a problem in combination with other (switchable) filters. In an IF strip with only 1 filter you hardly notice this. Note: I found one that is exactly 1.5 kHz too high. Could be for a special USB application. Measuring also shows that a selection of two cheap filters, low-cost from the above Murata series placed in cascade (also valid for cheap SFR455H filters which are not shown too "warp" after a measurement), stunning total results can be achieved for a fraction of the price of an expensive filter with the same performance! And with a much better stopband-suppression. The total loss is comparable. See my staggering measurement results. All other glued yellow multi-blocks, or filters with only three legs are a joke, you better ignore them. I buy my cheap SFR455H filters at Kent Electronics. With the higher price of some filters series they also conform to the specifications much better! The above examples are cheaper Murata consumer versions. Expensive crystal or mechanical filters provide great measurement results corresponding to the description. See a tested brand new filter from INRAD / Collins. Although the JRC company long ago sometimes "made a mess of things" in the filter specification description .... From an old JRC NRD-515 manual from over 30 years ago, here the specifications of the most expensive ”300 Hz” CW crystal filter block CFL-230 (YF455DPB): -6 dB, more than 260 Hz, -60 dB, less than 2 kHz. State cute as padding, but is uninformative and non revealing. As if you ask a car salesman for the maximum speed of a new car: at least 75 km per hour, but certainly not more than 300 km/h. In other words that always knocks, but you would rather have seen anything more accurate. Multiple copies JRC YF455DPB I have measured, the result at -6 dB is always near the ± 330 Hz, and at -60 dB: 1423 to 1468 Hz. The latter is, unfortunately, just very bad. Less than 700 Hz would have been better here, although in this case it perfectly falls within the previous vague definition. The shape factor, this is the 60dB/6dB ratio, is with all filters in excess of 4! For good expensive filters less than 2 is highly recommended, otherwise something is wrong. In those days, still no real ”astride” digital filters with good custom group delay were available! For RTTY was yet again a broader filter required (600 Hz, the red curve). This (now newly discovered) disappointing filter CFL-230, is in the past quickly replaced by JRC by the type CFL-231 (YF455FM) for all receivers manufactured after the NRD-515. And the CFL-230 was no longer available. After measuring I now understand why! |
|
 |
| JRC CW FILTER CFL-230 (YF455DPB) | KENWOOD CW FILTER YG-455CN-1 |
| In a PDF with 3 sheets | In a PDF with 3 sheets |
|
The story refers to the green curves in both images. The red lines on both images are a (different) 600 Hz Kokusai mechanical filter. So a rather disappointing JRC CW filter result. See also the JRC story on this site: https://people.zeelandnet.nl/wgeeraert/index515.htm#cwfilter A very good equivalent ”250 Hz” CW crystal filter block example (incidentally from the same NDK factory, with the exact same size and design) is the Kenwood YG-455CN-1 (note: with extra N!): Measured at -6 dB: 292 Hz, and at -60 dB: 471 Hz. Resulting shape factor = 1.61. That is a real class filter now! Compare the measured 471 Hz at -60 dB with the Kenwood data sheet. (for use in the NRD-515 you need 2 additional impedance and isolating transformers or toroids). Found in the Kenwood datasheet: -6 dB < 250 Hz and -60 dB: 480 Hz, that's beautiful. All this can be fairly accurately measured without expensive network analyzers! Obviously with the right surplus / dump-equipment and some hobby soldering for an additional buffer amplifier. Also some receivers (e.g. 4x JRC NRD-515) suffered from significant decline in performance (additional 6 to 15 dB attenuation) of the luxury Kokusai mechanical filters caused by decay of the inner foam to a sticky rubbery (IF-damping!) mass. What is the performance before and after a (hopefully not destructive) cleaning and repair turn. On this site some of the foregoing can be found. See: https://people.zeelandnet.nl/wgeeraert/index515.htm#kokusai So again: A good measurement and test set-up for 455 kHz filters was necessary. A selection of three images from a number of Kokusai cleanings (click to enlarge): |
|
|
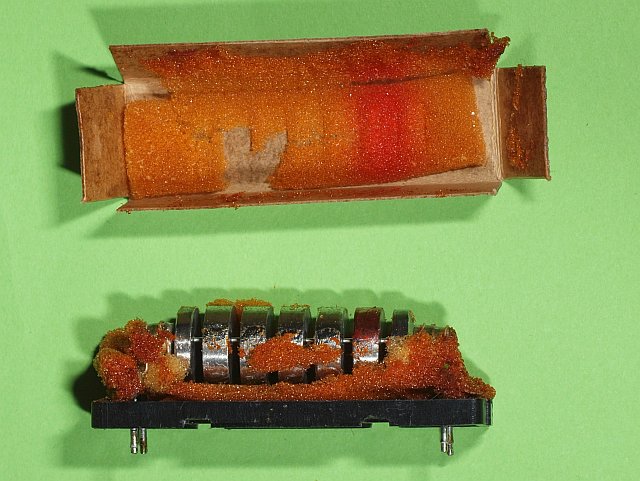
| 600 Hz from the NRD-515 - Before the cleaning Picture © by PE1ABR |
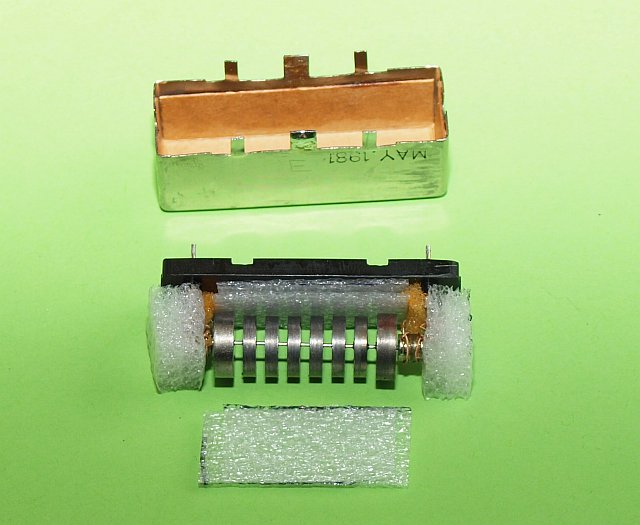
2.4 kHz from the NRD-515 - After the cleaning Picture © by PE1ABR |
|
Above are 2 different filters, one type is 600 Hz (which is still dirty by foam debris) the other is the 2.4 kHz filter (and that was just washed with acetone, isopropyl alcohol (IPA) or thinner, gently with a cotton tip, and equipped with new foam!). Note the filter design details: the thickness of the discs and their numbers! Compare that to the 600 Hz and 2.4 kHz filter width. |
 2,2 kHz from an ICOM Rx © by PE1ABR |
|
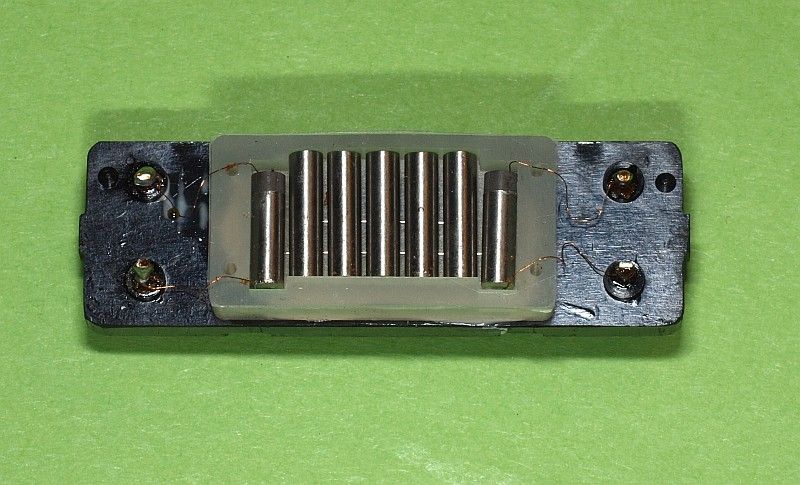
Except mechanical filters with slices or discs Kokusai (and Collins) also make them with tiny rods. Here an example, a 2.2 kHz Kokusai filter made for an ICOM Rx. ------------------- design stage 1 ------------------- A first (hasty) test is done with a regular LF signal generator and a sensitive Leader LF millivoltmeter that still is useable up to 500 kHz. A simple broadband measurement with an AC voltage of only 20 to up to max. 25 millivolts. The 10 millivolts output is recommended in a sparse manufacturer's specification (mostly something totally different, or nothing at all), this information is sometimes very hard to find ..... also see ***1) On the LF-millivolt meter smaller than 0.1 mV (= -40 dB) can be read fine on the 1 mV full-scale range! If the mains hum influence allows ... Hum is unfortunately so disappointing ... Although .... far away from the pass band we do a bit of smuggling by eliminating 1 or two -10 dB pads at the input. We make the input voltage a bit higher.. As a result we get yet easy the -40 dB range ...... In the first instance, there was no 1/10 probe for the millivoltmeter available because the input Z is 10MΩ instead of the 1MΩ standard, so an additional 1.1 MΩ terminator is required at the millivoltmeter input to apply standard oscilloscope probes. And an appropriate HF alignment.... Because of the dividing probe an additional negative 1/10 effect on the signal level occurs. A first test is, therefore, also hasty done with x1 probe, but that's actually alot wrong ..... the total parasitic C of a x1 probe and meter input together is at least 125 pF, that's not so good at all....! In fact, only the top of the pass-through curve (-6 dB estimate) is (unreliable) measurable and far from "deep" enough even to reach -60 dB in the stopband. The measured filter widths are more or less correct, but the top is in different shape now (pointed) and small wrinkles ( < 2 dB) are not shown at all due to the wrong capacitive load. |
|
***1) Some confusing background information. In many (most) datasheets NOTHING is indicated about signal level to the filter to be measured. At Murata in many cases (if it is not fallen away) 0 dBm ( = 224 mV) across (or from) a 50 ohms load is mentioned nowadays. Previously NOTHING. Also, I found the value of -20 dBm = 22.4 mV over 50 ohms being used in a R&S IF-filter network test-setup. 0 dBm (224 mV) is much easier to measure, but this rather high signal level will never be the real level in the IF stage around the filters. In other (older) material documents from Murata an LF generator is being used with a 600 ohm source Z. In that case the 0 dBm that is still used now over a 600 ohm Z (1 milliwatt) corresponds to a voltage of 775 millivolts rms. What is it actually? At -20 dBm (22.4 mV) to the filter input (at Rin = Rout) half is lost, so there will be approximately 10 mV at the output during the measurement. This is held as a more practical (real) and non-destructive zero-level, but a lot harder to measure ... The buffer upgrade, version 4, is finished now. In this version the gain is switchable between 10x and 100x (+20 dB / +40 dB) for the same final output voltage of 1 Veff. Matches a module inputvoltage of 200 to 250 mVeff for robust filters / or 20 to 25 mVeff in for vulnerable (tiny or SMD) filters. In the low gain mode near the "filter floor" extra gain is yet to choose. It lets you measure in the 10x mode (100x gain is then temporarily) eventually to -120 dB deep! |
|
------------------- design stage 2 ------------------- An input buffer and pre-amplifier is required, no 1/10, but instead, for example, x10, and also provided with a very low Z-out so we do not suffer from the cable capacity to the meter. The meter becomes with the low Z at the input again less noise-sensitive. Subsequent tests with a FET buffer and emitter-follower were taken with the overall gain = 10. The standard filter ballast-R, should determine the total Z, NOT what is attached after the probe. Even though the preamp is for HF (well, 455 kHz), large electrolytic capacitors appear necessary to suppress LF thumping noise and LF-hiss from the buffer. What do you .... with a 1 millivolt of full scale range (which is equiv. to 0,1 mV on the filter output)! A first draft is rejected due to too much LF thumping and noise ..... Without the 1000uF capacitor even in the extreme! 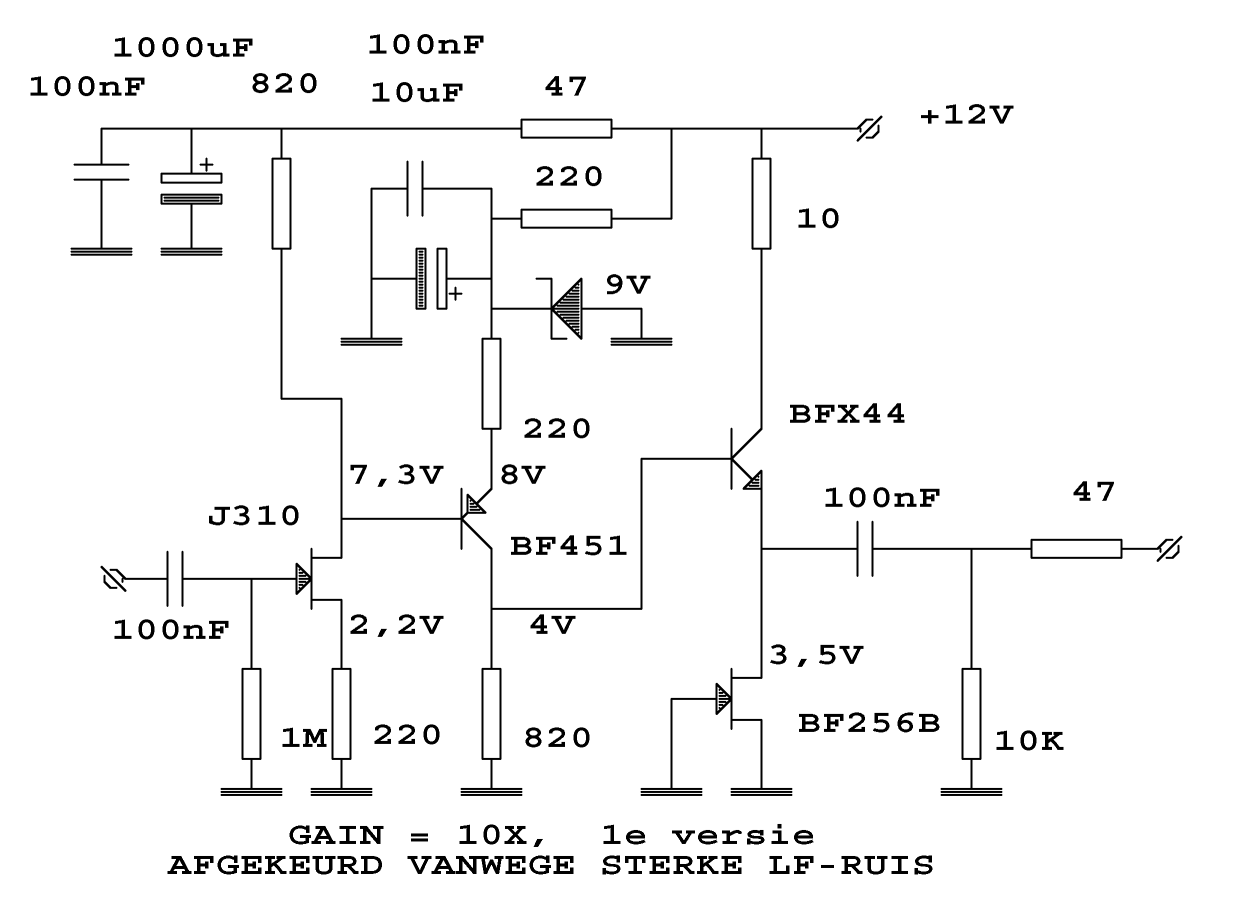 First version, gain = 10. Rejected due to too high LF thumping noise. Here ”standard” amplifier stages were used with local feedback only, so no strong negative feedback on several gain-stages together, namely: an input FET buffer with only a little gain, an additional stage to increase the gain to x10 and then a standard emitter-follower and current-source as the emitter ballast (gives even more noise?). This above design has already been in use for years as a buffer after an oscillator, and used in an added counter circuit in an analog receiver, signal level there is, however, 200 mV. But here it is apparently not OK, the signal levels are apparently too low ............ A second design variant made with 2 gain stages with strong overall feedback, each with 2 transistors / FETs. So much amplification reserve is ”eliminated” in the feedback. Remaining total gain = 10x (again). 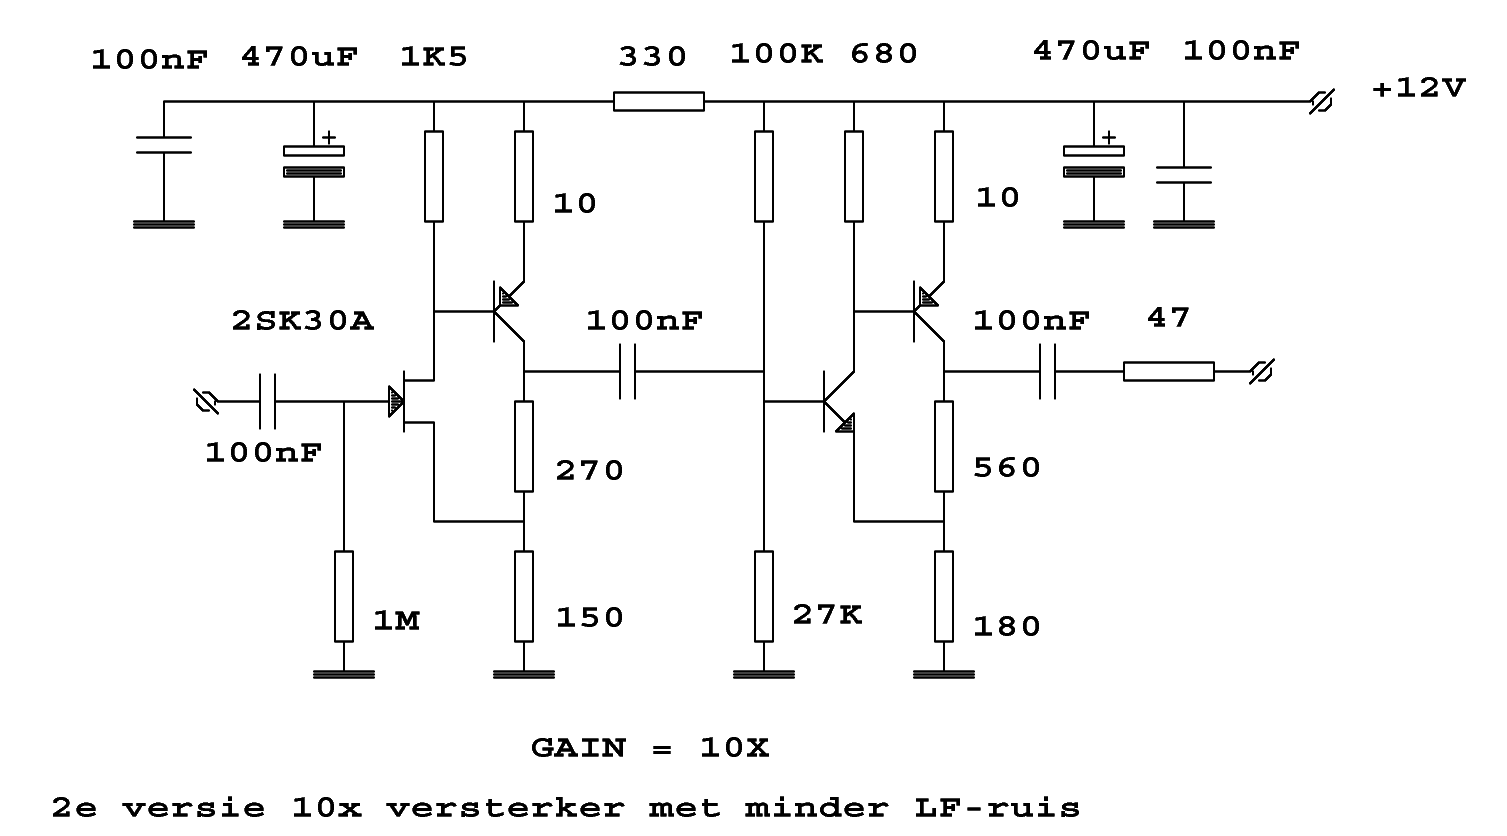 Second version 10x gain block, with much less LF thumping noise. Found on a flea-market a very old Wandel und Goltermann (W & G) SPM-2 (with antique AF118 and OC47 "geraniums"), and with the new buffer in broadband mode with a decent filter-load I could measure way down to -30 to -40 dB. Control signal is still from a separate LF generator. Here too the broadband noise soon limits again the measurement depth. The now existing narrowband measurement capability (SPM-2 width: -3 dB < 250 Hz, -6 dB 360 Hz!) is only nice to use if there is a tracking oscillator available. This option does not exist in the SPM-2, though, with the internal oscillator output bringing outside and external mixing with 650 kHz is not impossible. Not coupled, so two separate units to tune, proved to be too cumbersome. ------------------- design stage 3 ------------------- A W&G SPM-3 set found with the help of a radio friend (THANKS!!) With separate tracking generator PS-3. Thanks again! Is even narrower in the tuning (-3 dB = about 100 Hz, -6 dB at 175 Hz!) Still an older version from the "geranium" era, but much more advanced than the SPM-2. Has an extra LF amplifier stage in selective mode and thus can measure 30 dB deeper! First, continued with the same wideband measurement circuit as with the SPM-2, only slightly deeper measurement is now possible. Here, too, the broadband noise limites use in wideband mode to go deeper than -50 dB to be measured. The noise level is at -60 to -70 dB. Reminds me of the noise level of old cassette player / tape recorder amplifiers. There also the noise and interference level is not infinite low....... In other words deeper down is just not OK in broadband mode with simple not noise-limited preamplifiers. Very narrow-band measurement is the only way to go (in order to further reduce the noise), and that is possible now because I got an associated tracking generator. Unfortunately the SPM-3 set initially did not work OK..... After 2 weeks of tinkering, the problems with the SPM-3 input circuit and the incorrect adjustment of the mixer in the tracking generator were solved. (Z/Ohm switch mechanical malfunction and low input Z blown or broken, and a thread of a pot core transformer broken). I.e., the SPM-3 is working now, but only in the 5 kOhm input impedance mode. Not a problem. The LF millivoltmeter indicates exactly the same signal level with e.g. 10 or 100 mV, so that gives confidence. Also spent some time to make some beautiful adapter connectors from CF1 (3x banana) to BNC. See a separate sub-page. The deepest selective range (full scale) is now -80 dB, -100 dB is possible to read. These dB values are related to the input range of 1 V = 1000 mV (input voltage)! The measuring voltage for standard IF filters however is in my case only 10 millivolts maximum output voltage, i.e. 10x buffer amplifier gives only 100 millivolts output ... So basically we are 20 dB too low in gain. 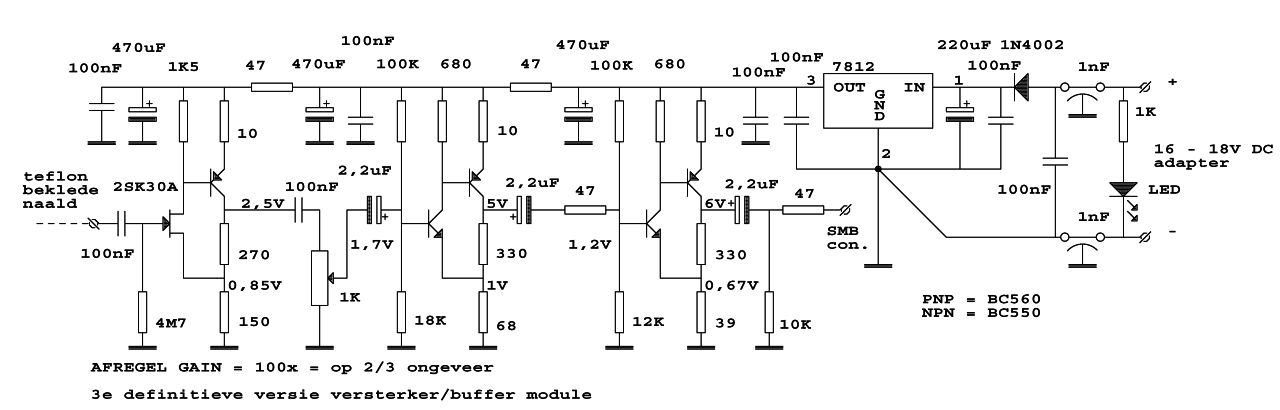 Third version of the amplifier / buffer module. Total gain = 100x, to be set with potmeter on 2/3 setting. After several tests and messy adjustments (in dead beetle technique) the buffer / amplifier built for the third time ..... Now, with 3 strong feedback stages and also some spare gain, with a multi-turn potentiometer adjustment for exact setting to 100x. To prevent odd oscillation feedback the 100x gain setting NOT via gain-feedback, but kept a bit simple. Gain of the buffer is now at 100x, with a 4M7 input Z and a para-C of 10 to 12 pF max. when mounted on a circuit board experimental test strip. MEASURED! (additional R Series 4M7 - identical to R-in - in parallel with a trimmer C: C rollback to 50% compared to a link over that C. Measured at 455 kHz. C-trimmer is then equal to the input C). Rockwell / Collins allows for a total capacitance, including all strays, of 30 pF on the IN- and OUTPUT. Hold on! what do I notice now! Without mounted filter I suddenly hear mains supply rattle noise at a LF "listening test" with a LF signal follower connected to the buffer output. The ground wire of the power adapter (± 18 V DC unstabilized out!) can apparently NOT directly be connected to the ground of the tin-can from the buffer! An incorrect ground loop causes an increased rattle noise level of the adapter. And yet there were already HF by-pass C's over the rectifier diodes. So pay attention to internal grounding and ground loops. That again adjusted, minus of the power supply will now go through an additional passthrough C and is kept separate till connected to the 7812 ground point and the local by-pass Caps in the buffer box: rattle solved! 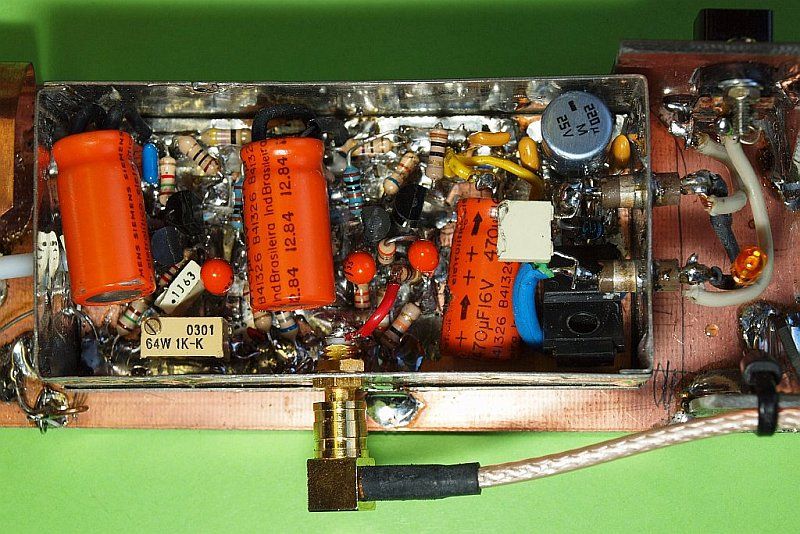 A view in amplifier module version-3 Still large electrolytic capacitors are required on the 12V powersupply line to suppress LF-thumping, in any case to counteract against "motorboat" oscillation effects. I also have applied large 2.2 uF tantalum capacitors to the input as a coupling-C between the stages to force a low impedance over there and thus LF "calm" the input. Even placed a "big" C to the high-Z input FET, although it seems meaningless there, this also acts on the calming of LF cluttering noise and hum sensitivity of that input! Of course, locally an oscillation stop-resistor. Also: one output capacitor (to the gain potentiometer) is still kept low in value (roll-over point ± 1500 Hz) in order to suppress hum voltage from the measurement results, and therefore to prevent overdriving an amplifier stage. The amplifier is still NOT selective! Also, the final output stage should have the necessary "headroom" reserve and symmetrically clipping, because 1 Veff is almost 3Vtt. And preferably one or more volts reserve.... 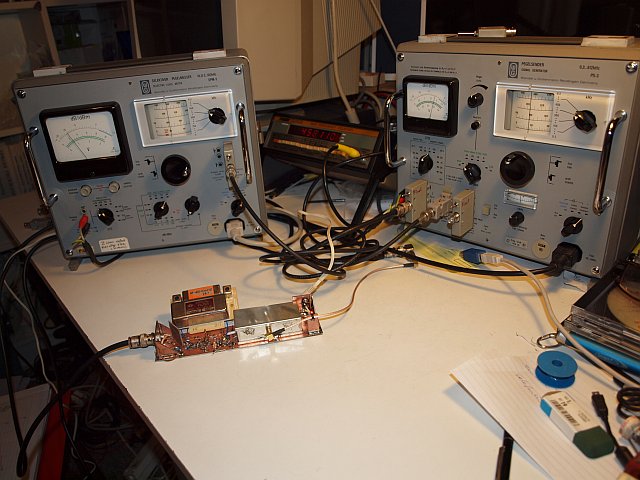 All connected together...... 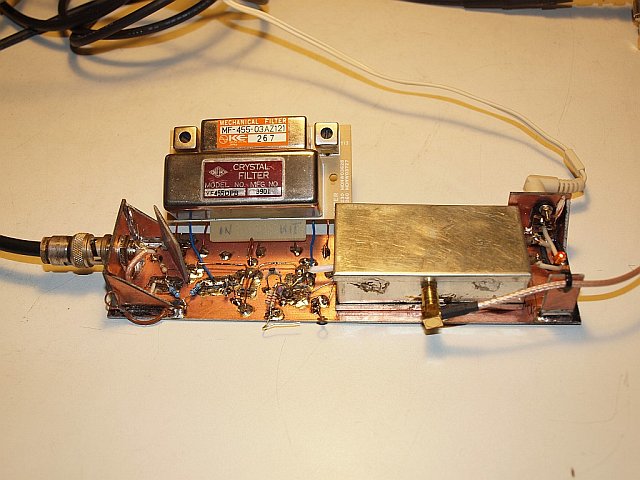 Another nice picture of the older version-3 with the open construction. Yet easily a bottom of -80 to -90 dB was reached. Now completely closed and shielded. 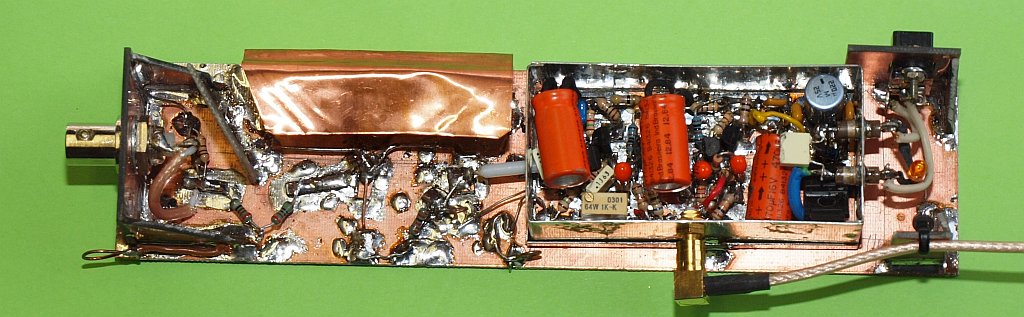
After about 50 measurements with version-3, the solder blobs are a little bit taller ..... A glimpse into the box. ------------------------------------------------------------------ design stage 4 ===> also version 3 with an update ------------------------------------------------------------------ After 2 years of measurements and more internet searching, the following developments. In the latest data sheets from Murata suddenly 0 dBm is stated instead of nothing in terms of signal level. That's 10x more than I keep to (250 mV measure module-IN instead of 25 mV). Unfortunately again there is not mentioned if this is 0 dBm for LF 600 ohm measurement, or for 50 ohms. Small (mainly SMD) filters should be measured either at 0 dBm or rather down to -10 dBm. In the 4th version I maintain the 100x amplifier gain = 40 dB (I show why shortly), but also with the new ability to set 10x channel gain (corresponds to 20 dB). Related to 50 ohm-Z so 2 possibilities: 100x gain for measuring at -20 dBm (20 - 25 mV module in, 10 mV filter out) or 0 dBm (200 - to 250 mV module in, 100 mV filter out). The amplifier module output is always 1000 mV. Special trick: in the 10x mode (so about 250 mV input = 0 dB on the level meter) is at very low levels anyway to switch to 100x gain. Instead measuring up to -100 dB deep, you suddenly get -120 dB in reach! After construction of the 4th version in the current building method shows that only theoretically you would be able to ..... There is too much HF leak in the open construction, which under -80 to -90 dB the influence is already strongly noticeable. The curve jitters in the bottom line of the curve are half determined by the leak and the other half by what comes through the filter. (a Phase / vector sum!) But a combination of three adjustments show that the leakage level can be reduced by about 20 dB. 1) the module corner with the BNC connector is completely shut. 2) the filter being tested should be shielded 100% from the outside environment, so whether with a properly grounded PCB-clad box over it, or with a double copper foil flap folded over each other. 3) even that was not good enough: the very short wires to and from the filter leak to each other, between the metal bottom and the top screen flap an isolation sheet between IN and OUT pins was needed. Total effect: there may still be well measured below -100 dB, the parasitic floor is lowered 20 dB. These adjustments are applied in the still-used version 3 (upgrade 2) and version 4 with switchable gain, which is applicable to -120 dB. With the observance of the restrictions due to still some leak. And: -120 dB compared to the zero level of 1 Volt on the SPM-3 and 100 mV fllter output. What is the difference between 2 measurements with HF leak and the same filter measured "without" (20 dB lower) HF leak? This is only visible with a filter or combination that can come out under the -100 dB ... Eg. a cascade test or an extreme good filter. With leak the bottom curve is a bit smoother / more undulating, with 20 dB less leak it is much more capricious. In the cascade test in the shielded version 3 you see nothing, NO bottom base line, you're minimum is at -100 dB and the curve goes lower! In version 4 (with extra gain on) you can see some undulations. How to do with some leak?? Leakage is made visible due to the screen between IN/OUT omitted temporarily! With "no"(= minimal) leak you see something back of the jagged peaks of the filters measured inividually, but very far below ..... deep down .. Here a check test with in one set some HF-leak and in the second one 5 to 10 dB lower leak by adding the shim between IN and OUT. The module-4 version. And here the older measurements with module 3 with more leakage. Bottom right in the two red and green curves from filter 3 and 4 you see separate specific curls and jumps. In the combination/cascaded curves with "minimal" leak above you see some of them back. 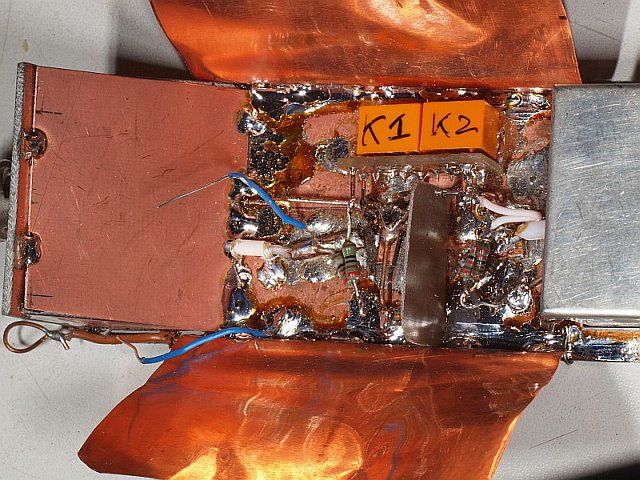
Click picture for a larger version Here is a detail picture of the last HF leak guard adjustments in the 3rd building version. With a double copper "tile" and the BNC section completely closed. Even with an additional screening between IN and OUT. You see a cascaded filter test with 2x SFR455H on a special add-on PCB. The mounting pins have the same layout as a larger expensive Murata filter. 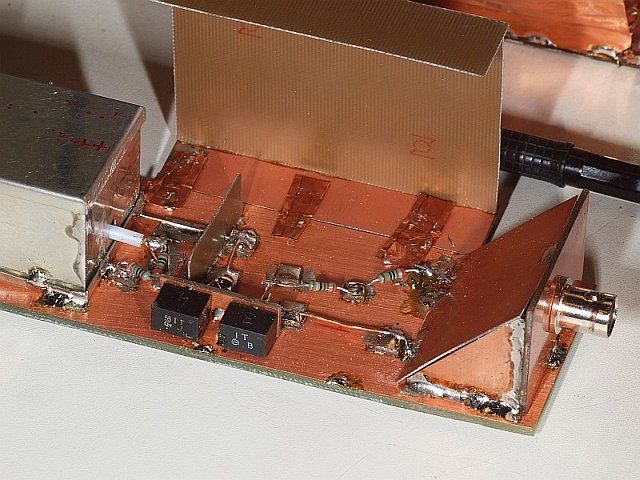
Click picture for a larger version Here a detail of module V2 (4th build), not much solder blobs yet. Also visible here the latest shielding between IN and OUT pins. No double copper "tile" on top, but a special shielding container. Also, the BNC part is sealed. You see a duo (cascade) test with 2x CFW455IT on a special add-on PCB. 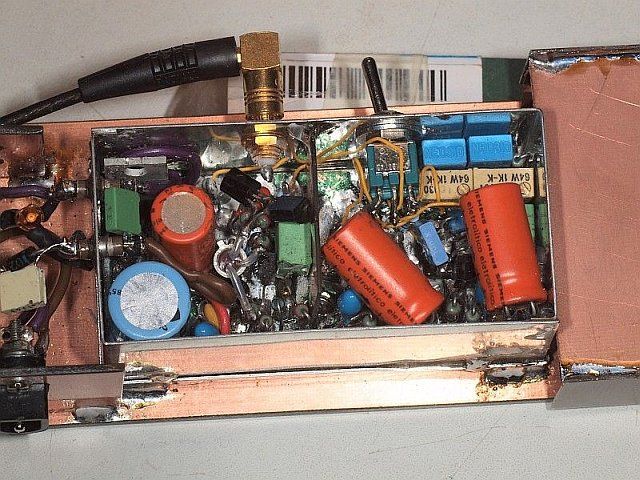
Click picture for a larger version Here a detail of the amplifier box version-2 (4th build). With two gain potentiometers and a switch. Behind them the two blue Neosid blocks, part of the proved necessary low-pass filter. Also an extra screen is visible. Between the SMB connector and the metal transistor (BSX20) you see the two current-source FET's who force a lower Z-out from which a maximum undistorted output voltage is easier achievable. The shielding container over the filter is "folded" down.  And this is the final circuit diagram in version 4. A click gives the double resolution. Or even higher in the PDF Beforehand a new problem arose: Because of the loose wiring around the additional switch, the amplifier became unstable when the gain has been fully rotated clockwise. Is was not between the stages, but rather from output back to the high-ohmic input. That was in some 10th-MHz numbers. Only with a simple low-pass T-filter (NO PI!), with a neat potentiometer R as resistive-ballast, the amplifier was stable again. The filter starts with a few dB at about 800 kHz and higher, and falls strongly above 1 MHz. By adding the 10 nF (first 100 nF) capacitor below 50 kHz all the hum and noise is also be pinched... Heavy loading the output showed that an additional emitter follower was convenient for distortion-free signals. But even with that added we yielded too little headroom reserve (a small flat spot on the lower sine dip, only with extra ballast). With the installation of two additional current-source FET's for pulling down the sine wave, this also worked out without excessive complexity. ------------------------------ some additional issues. ------------------------------ A filter measurement gives only correct curves if terminated correctly. Input and output impedances must be correctly matched. If, for example, the recommended filter Z = 2000 ohm, that value should be exactly met. You make it yourself with 2K2 in parallel with 22K (or 2x 1 K in series, but this gives more parasitic capacitance). At the input the generator source-Z resistor is also subtracted from the feeding-R to the filter. Because the generator doesn't care much about the 50 / 75 ohm difference (it is not so critical, Gen. itself is 75 ohms), so after 1 meter of 50 ohm coax to the measuring module there is a terminator-R of 2x 100 ohm parallel to ground. (In the CF1 to BNC adapter plug a 22 ohm resistor is added later!) This module construction is more universal, also for other generators. From that 50 ohms to ground do use the correct filter Z minus 50 ohms to the filter input. For example, for the 2000 ohm above, needed is 1,950 ohm = made of 150 ohm + 1K8 in series. It would actually be more correct to use 1925 and 75 ohms (and a 75 ohm feed cable), but that small difference is NOT noticeable in the current setup I think. This setup involves measuring the loss level only by measuring the difference between a "wire" between the input and output resistances pair's (without filter) and the effect with the filter in between (so without the wire). They are "relative" measurements. On the input keep parasitic HF leak low. So some form of shielding is needed against "leakage" of HF over the filter, so here a feeding set of two R's in series is handy for a "go around the corner" trick. The largest R first. See on the picture below near the input BNC. Because it is unpleasant to roast or toast quite a number of mini filter blocks to a large copper ground plane, there are 0.5 mm ground wires on pieces of PCB-clad board. At several locations they are grounded! In the middle is small a "dip" in the ground wire so there is no problem with the input tab and several GND tabs adjacent to each other in a filter block from the CFW / CFU series. Once more the measuring method complete (also see diagram below): With a small wire between the resistor networks set the SPM to "0" dB position voltage from the generator. Afterwards with the filter soldered-in, tune around 455.000 kHz to find at which frequency the difference is minimal. Write down the loss difference, and after that set the generator once more to "0" dB position. This first step is to (only) measure how much dB difference between "with and without" filter and to find the optimum peak. Then continue to the next steps to find all "tops and drops" of the curve and the slope points. See the fill-in sheet for example points. 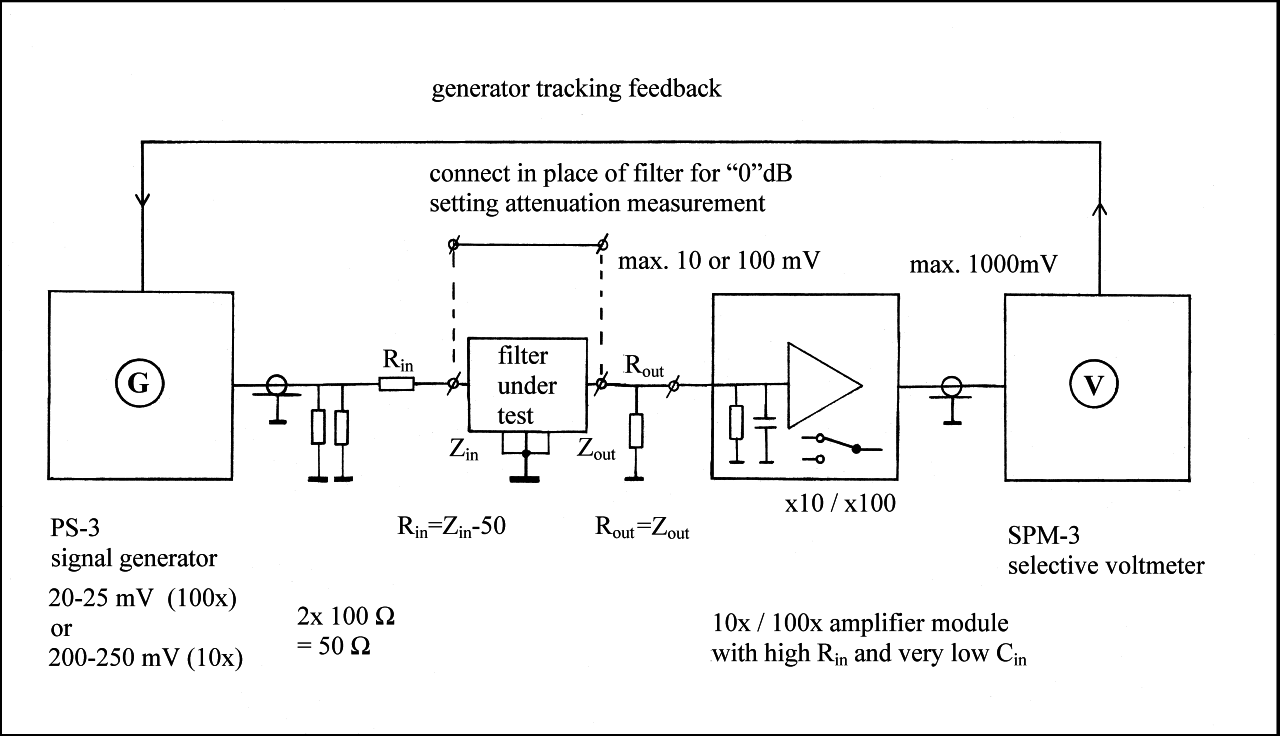 Here the 4th version = Update V2 which is more universal. Here the 4th version = Update V2 which is more universal.
High resolution version in PDF In a separate PDF document a whole series of example terminating resistor values for many filter Z's. How to obtain them in parallel and in series arrangement. Also a separate column for input series R set, but than adapted for both 75 and 50 ohm generator-Z ( R-term = Z-filter - Z source ). In an other PDF document an example measuring fill-in sheet. Fill in with pencil! The more readings you do, the faster it goes, but also "mistakes" ... A change with an eraser is still neater. Later, a "tile" sheet of thin copper foil is soldered to the measuring module. Which is bent over the filter if it is on its place during measuring. This suppresses the effect of the hand influence and some DX(!) from mains pollution. Naturally, the amplifier module is in a tin box. The input pin comes out through a 1 cm piece peeled (hard) UHF coaxial teflon (without mantle, and with a hard silver-plated steel inner conductor), only a piece of teflon inner core with white tip protrudes out. The output is a mini click coax connector type SMB with a short mini coax to an adapter SMB to BNC plug. This module must be reasonable remain mobile (all connections with plugs / connectors) because of the increasingly repeated move between the ”soldercorner” and ”measuring site”. If below -70 dB I have a restless meter needle, I sometimes wind even a piece of aluminum foil around it. That helps a little, especially at evenings! (a few dB lower reading under -80 dB, mains pollution of the switching power supply's perhaps?) Keep an eye on the very low levels compared to 10 mV for the zero level: -80 dB = 1 uV, -90 dB = 0,3 uV en -100 dB = 0,1 uV. Quite extremely low!!!!!!!!!!!!!!! What is funny is a rare spurious, very narrow false pass peaks (or dips!) in the suppress (blocking) region. Rather no spurious incidentally. Vigorous intensity differences (actually jumps) between -60 and -80 dB may be present. These are unwanted effects that sometimes are quite close to the desired pass-through. I found them only in a single filter to around 430 to 436 kHz, both in a mechanical (Kokusai) as a ceramic filter (Murata). After building version 4: Both the spurious and the overall shape of all "jitters" below -90 dB is strongly dependent on the HF leak back over the filter. It is even possible (without additional shielding between IN and OUT), it is purely the leak that determines the slope of the curve below the -90 dB! So with every other measuring arrangement the curve at the zero line may fractionally be different. Partly because of more experience in the construction of version-4 (which may be usable upto -120 dB! The results should be of any use....!), is the shield adapted, the BNC-part is now equipped with a complete shield. The teflon-pin at the other end is likewise provided with an additional baffle. The copper "tile" is now extended, one both above and one below the filter. During measurement they are folded over each other, overlapping the filter packet. The reliability of the zero line is thus greatly increased. A combination of two simple selected (standard) ceramic filters give superior results. Please refer to a lot of examples in the PDF files.(Use the link in the 455 kHz index page, or here directly.) Due to the improved shielding, the curves will look a little better. Individually they have such a "high base curve" that the additional shielding gave not much difference there. Only under the -80 dB, the effect is high. I also noticed that ceramic filters unfortunately are quite sensitive to temperature change! More than I expected! During the measurement, shortly after the soldering in in the measuring strip, I noticed a proper course of at least 50 to 200 Hz. Apparently still too hot after 10 to 15 minutes?? Wait a minute, I will consider bullying such a thing with only 1 syringe of "Freeze spray". Is equal 1000-1500 Hz shift of the zero point, and 1 to 2 dB more attenuation. With a hair dryer on it, it popped right back to 1000 Hz to the other side of the zero-point .... It takes a long time afterwards before the level indicator is back to the original setting. It all seems simple, but it took still some effort to get nice graphs from Excel. Since in some combination XLS-es sometimes a number of column measurements boxes are skipped, the XLS program there likes a break the curve, I want a continues curve! Options to adjust that are NOT hidden in the graph settings, but somewhere in the program! This goes also for multi-axis adjustments that were necessary for a copy of an existing curve to make a zoom-in or zoom-out version. Those options only appear when you click on the appropriate axis point. They unfortunately are NOT in reach in a large overall settings menu. Very fragmented for me as an ”incidental” Excel user. Also the standard Excel chart title field appears to may contain not so much explanation text as I want. I.e. only 255 characters. I wanted a real "text" field at the top wthout limits. Only by deleting the too small title field and to copy and paste a new text field, I ultimately was able to place the informative text above the curves I wanted there. Also this again is solved. All the many zoom-in and zoom-out graphs from one single measurement ( in one XLS) are all generated automatically from one column of figures! More curves from more colums in the same graphs!  Sketch of the measuring setup. Clicking is even larger. High resolution version in PDF ----------- epilogue ----------- This measuring method appears to yield excellent results with hobby resources. Unfortunately, you must have access to a (surplus / dump) selective voltmeter with the corresponding tracking generator. The oldest (not useful) set of SPM-2 that I've been handed is seen used nostalgic germanium semiconductors from the early '60s. The SPM-2 is not equipped with tracking capability. The used SPM-3 is also an early version, it contains virtually no silicon transistors, but many AF126, I estimate this from around / after 1965. A third set (also SPM-3) that I saw opened was again estimated around 1970, it contained virtually no more germanium but many BCY silicon types. A standard analog receiver in place of a selective voltmeter at 455 kHz has a strength level indicator (S-meter) (and gain stability?) not directly suitable for this application. Perhaps can be made suited to? Probably too inaccurate? Perhaps a calibrated modern software DSP receiver setup is something for this measurement application! Measuring and afterwards tap-in in Excel has shown to be a fairly labor-intensive activity. But the results are downright beautiful. It gave me at least much more insight into this matter and how to interpret the specifications from Murata ceramic filters ! Walter Geeraert PE1ABR |
 Back to the 455 kHz index
 |
|
| IF filter test setup - UK version Compilation by Walter - PE1ABR - 2024-03-04 |