A model of mussel bed pattern formationMussel beds are a prominent feature of intertidal ecosystems. They often occur on the seaward edge of tidal flat. Here, the filter feeding mussels can make optimal use of the algae in the seawater when in enters the tidal flat area during the flood tides. When a mussel bed is viewed from the air, they reveal a remarkable spatial organization. Mussel beds are strongly banded, with elongated mussel patches of 2-3 meters across alternating the open, bare areas of 3-4 meters. To explain pattern formation in mussels, one needs to take into account the two most basic processes that determine mussel live: they need to eat, and they need to be safe. Below, I explain how this works. Mussels make a living by consuming the microalgae – diatoms for the most – from the lower water layers of the water column. In dense beds, this can lead to fierce competition among the mussels for the algal food. Luckily for the mussels, the water flow, bringing fresh food for a long as the incoming tides flow. There are two imminent dangers threatening the life of a mussel. The first is being eaten by birds or sea stars, the second is being washed away from their favourite habitat. They protect themselves against the danger by attaching themselves to other mussels using byssal threads, forming extensive mats of mussels. This means that mussels are more safe as there are more fellow mussels around. A simple model suffices to show that the interaction of algal competition and density- dependent mortality can explain the formation patterns in mussels. This model describes the interaction of the concentration of algae A in the lower water layer, and the biomass of mussels M on the tidal flat: ∂A / ∂t = γ(1 - A) - AM - ν ∂A / ∂x ∂M / ∂t = ηAM - δ / (1 + M) M + ∂2M / ∂x2 + ∂2M / ∂y2 In this non-dimensionalized model, γ (gamma) denotes the influx of algae from the higher water layers, ν (nu) describes the rate of water movement, and η (eta) is the growth efficiency of the mussels, and δ (delta) is their mortality rate when alone. Despite of its simplicity, this model is well capable of explaining the spatial patterns that are observed in mussel beds. Try the above java applet to get aquainted with the model. The applet actually runs the following model: ∂A / ∂t = γ(1 - A) - AM - ν ∇w + d∆n φ ∂M / ∂t = ηAM - δ / (1 + M) M + ∆M where ∇ and ∆ are the gradient and laplacian operators, respectively, and d represents turbulent diffusion of the algae. φ respresent an acceleration parameter that bridges the time gap between water movement and mussel growth. Reference: |
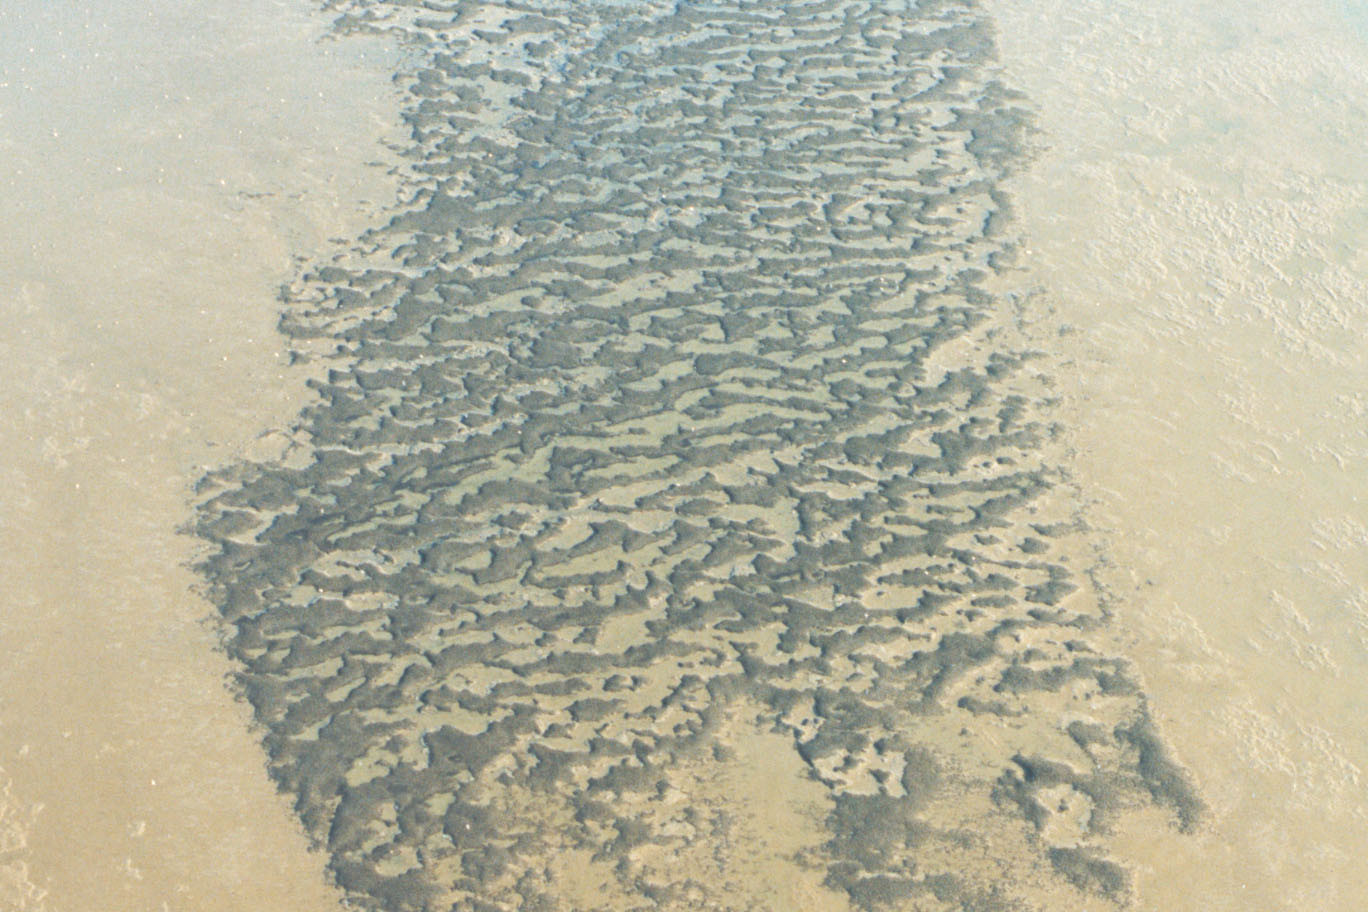
A patterned mussel bed in the Waddensea to the south of Amerland, in 1994. |